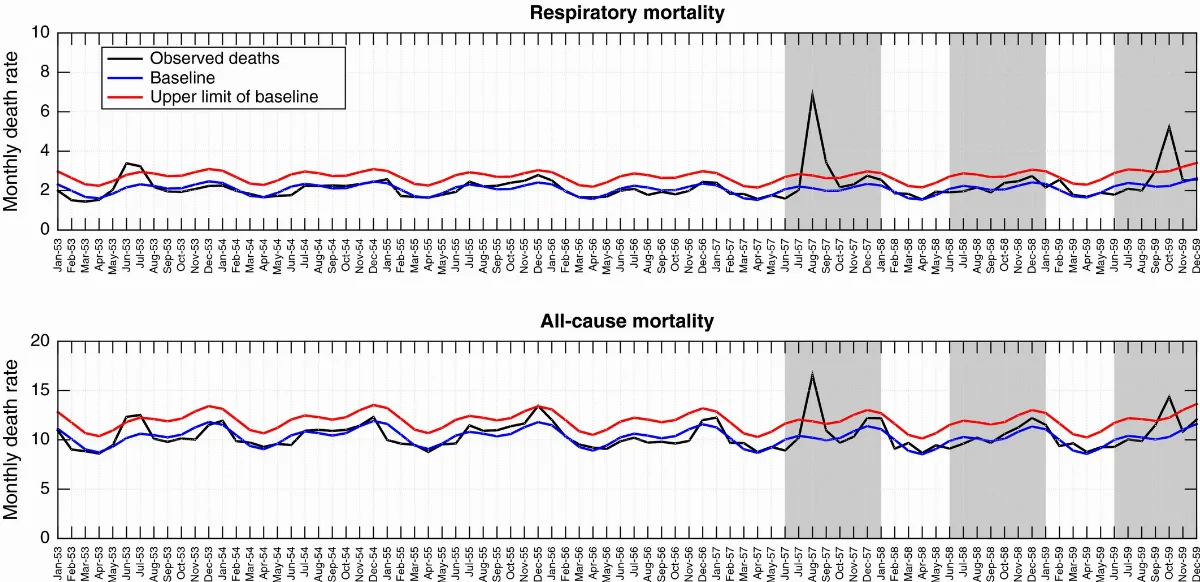
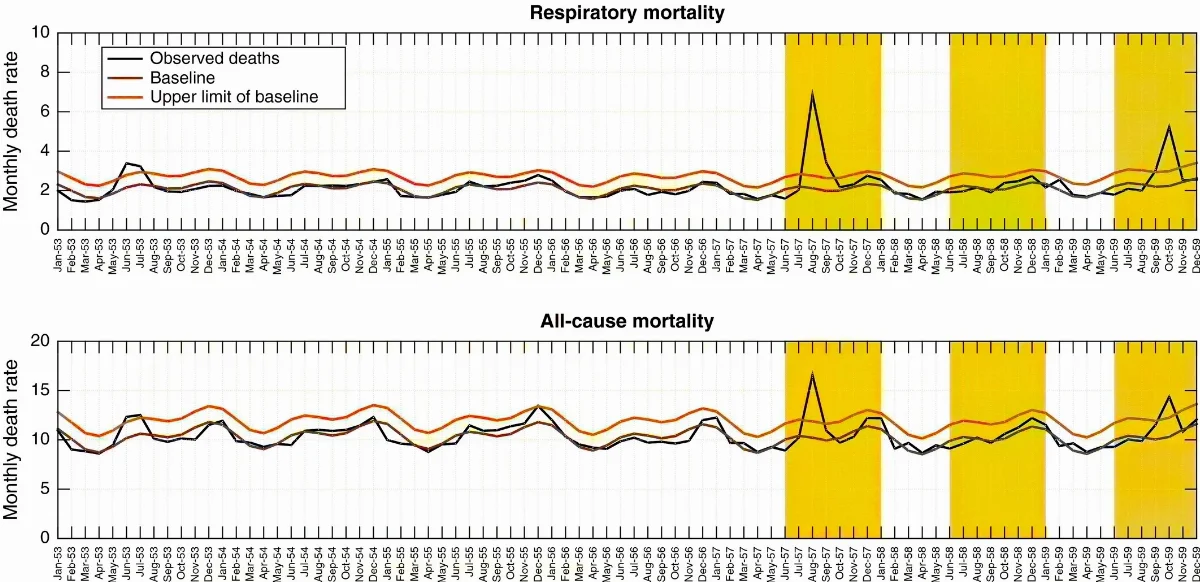
Monthly time series of all‐cause and respiratory mortality per 10,000 people in Chile, 1953–1959
"Monthly time series of all‐cause and respiratory mortality per 10 000 people in Chile, 1953‐1959 (black curve). Shaded areas highlight three winter periods (Jun‐Dec) during 1957‐1959. The Serfling seasonal regression model baseline (blue curve) and corresponding upper limit of the 95% confidence interval of the baseline (red curve) are also shown"
Licencia Fecha
1953 (Ano)
Lugar +5 pts
Etiquetas
Wikimedia Commons
Década 1950
Fuente / Crédito
Gerardo Chowell Lone Simonsen Rodrigo Fuentes Jose Flores Mark A. Miller Cécile Viboud — Wikimedia Commons (CC BY 4.0)
Parte del fondo
Fondo Wikimedia Commons — Chile CDA-WIKI-001 Fotógrafo
Gerardo Chowell Lone Simonsen Rodrigo Fuentes Jose Flores Mark A. Miller Cécile Viboud
Subida por
Wikimedia Commons
Comentarios
No hay comentarios aún. Sé el primero en comentar.